📈 Reporting
WATA includes a comprehensive reporting system that provides visual analytics and performance tracking for your trading activity.
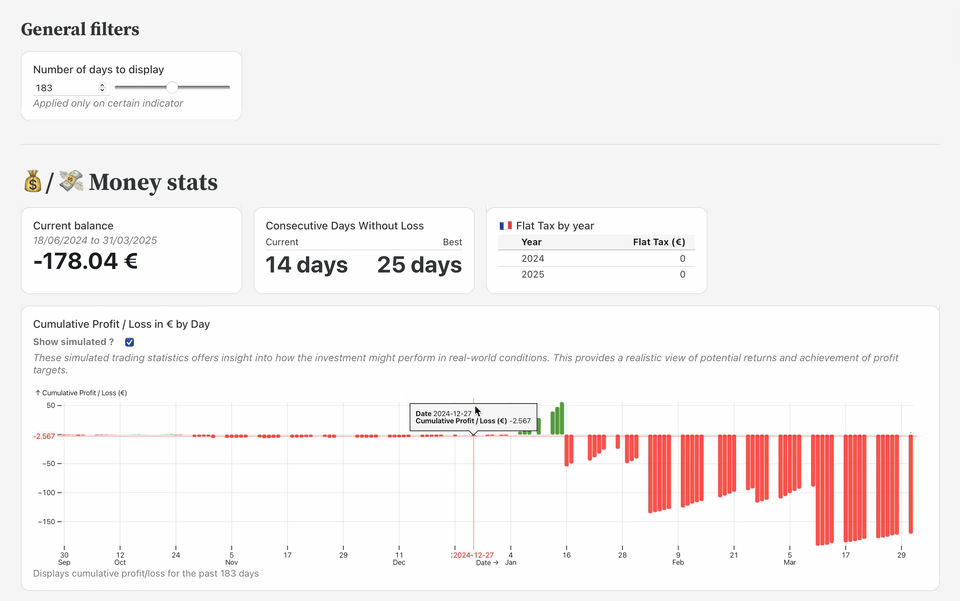
Dashboard Overview
The reporting dashboard is built on Observable Framework and provides:
- Daily and cumulative profit tracking
- Performance analysis by action type (long, short)
- Win-rate and position duration metrics
- Interactive data exploration
Setting Up the Dashboard
Requirements
To use the reporting system, you need:
- Node.js and npm installed
- DuckDB CLI installed
- Python 3.12+ (with required libraries in
./reporting/requirements.txt) - Ansible configured with proper inventory (same as deployment stage)
Dashboard Setup Steps
-
Run the Setup Script
./reporting/setup_dashboard.shThis script creates a new Observable Framework project in
reporting/trading-dashboard. -
Sync Trading Data
./reporting/sync_reporting_data.shThis script synchronizes your trading data from the server to your local dashboard:
- Fetches DuckDB data from your production server
- Exports the database to Parquet format
- Generates the necessary JSON files for visualization
- Copies all data to the Observable Framework project
-
Start the Dashboard Server
./reporting/start_report_server.shThis launches the development server on port 4321. Access the dashboard at: http://localhost:4321
Available Reports
The dashboard provides several views to analyze your trading performance:
1. Performance Overview
- Daily profit/loss chart
- Cumulative performance tracking
- Monthly and weekly summaries
2. Trade Analysis
- Performance by trade type
- Average trade duration
- Win/loss ratio
- Profit factor
3. Risk Metrics
- Maximum drawdown
- Risk/reward ratio
- Volatility measures
4. Time Analysis
- Performance by time of day
- Day of week analysis
- Trading frequency metrics
Customizing the Dashboard
The Observable Framework makes it easy to customize the dashboard:
- Edit files in
reporting/trading-dashboard/src/pages/to modify existing views - Add new pages for custom analyses
- Adjust visualization parameters in the configuration files